Audit Log
- Direct Message Report
- Human Readable CCDA
- Adding an Implant Device
- Vaccine Screen Changes
- Automatically Import Pharmacies
- Audit Log
- Viewing Secure Messages and requests in the EHR
- Clinical Note Types
- Previous Name and Address
- CCDA Export Subset of Patients
- Additional CCDA Export Data
- Searching for Patients
- Managing Patient Information
- Patient Exams
- Schedule
- Flowsheets
- Patient Intervention and Health Maintenance Profiles
- Case Management
- Orders
- Sending and Receiving Messages
- Reports
- Dragon Naturally Speaking Voice Integration
- Vocabulary Editor
- Diagnosis Director
- Primary Care Features
- E/M Consultant
- Patient Tracker
- Referring Patients
- Referral Reply Letter
- Fax Viewer
- Legacy Audit Trail
- Error Log
- DataShare
- ICD-10 Setup & Training
- CCDA Data Export Guide
- Regulatory Report
Important information about Audit Log changes for ChartLogic EHR Version 9.1.2
Significant changes were made to the Audit Log in version 9.1.2 to meet the latest regulatory requirement. This required database changes that are incompatible with the Audit Log in previous versions. For this reason, there are now 2 Audit Logs: The default Audit Log, and the Legacy Audit Log. User actions made after the upgrade to 9.1.2 will be seen in the Audit Log. Actions taken prior to upgrading to 9.1.2 are found in the Legacy Audit Log. The new Audit Log records significantly more information than was recorded in previous versions.
Opening Audit Log
Find the Audit Log under the Tools Menu as the first option.

Audit Log Screen
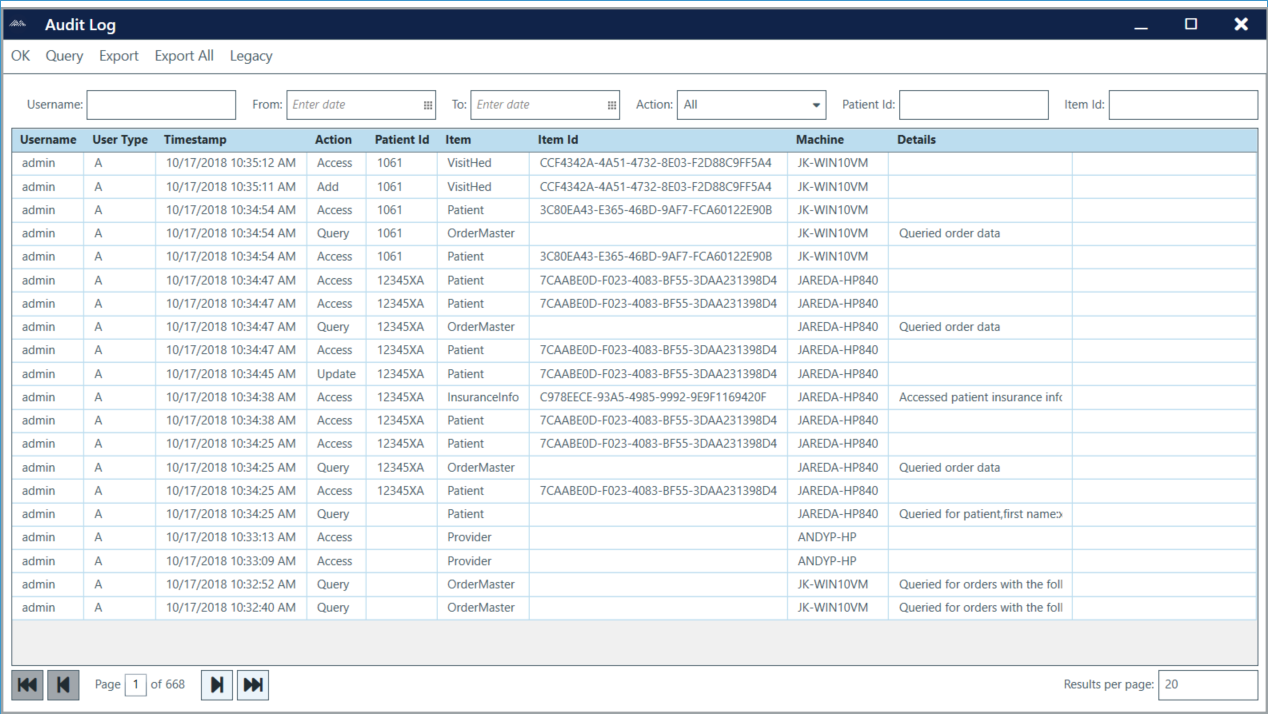
The Audit Log will open to a screen showing the most recent set of records. From this screen you can perform several actions, including the ability to access the Legacy Audit Log, which is the last menu item option at the top right. We will cover all the other menu items below.
 Menu Options
The menu options are listed in the table below. This view also shows the area in which you can enter search/filter parameters which are described more fully in the next section.

| Option | Description |
| OK | Close the Audit Log window |
| Query | Query the Audit Log using the specified Filters. |
| Export | Export the results of the current Audit Log query results in a *.tsv file.
WARNING! Export could talk a long time if there are many results. |
| Export All | Export the Audit Log results in a *.tsv file.
WARNING! Export All could talk a long time if there are many results. |
| Legacy | Access the Legacy Audit Log which recorded user actions prior to the ChartLogic EHR 9.1.2 release. |
Search and Filter Audit Logs
Below you will find a table listing the different ways to view the Audit Logs.

Search and Filter Parameters
| Field | Values | Description |
| Username | Alphanumeric | A user’s username |
| From/To | Date/time | Date range to restrict results to |
| Action | Type of action:
· All · Access · Add · Delete · Merge · Query · Transmit · Update |
· All – Show ALL results within parameters · Access – Show Access logs only · Add – Show Added items · Delete – Show Deleted items · Merge – Show Merged items · Print – Show Print items · Query – Show Query items · Transmit – Show transmitted items · Update – Show Updated items
|
| Patient ID | Alphanumeric | The Patient ID/MRN of the patient |
Sorting Columns in the Data Grid
To sort a column, click once on the column header to sort ascending (A-Z or Newest to Oldest), click again to sort descending (Z-A or Oldest to Newest).
![]()
Column Sort Parameters
| Column | Sortable | Description |
| Username | Yes | The user who performed the action. |
| User Type | Yes | The type of user
· A – Administrator · U – Common user · S – System user (e.g., an API that ties into the Practice Management system) |
| Timestamp | Yes | Date and time when the action took place |
| Action | Yes | Type of action
· Access · Add · Delete · Merge · Query · Transmit · Update |
| Patient ID | Yes | The Patient ID/MRN of the patient |
| Item | Yes | The type of information acted upon. For example:
· Patient – Data stored on a patient’s record · VisitHed – Data stored on a patient’s encounter record · PatientMedication – The patient’s medication records · Etc. There are too many possibilities to list here. Please contact support if you have any questions. |
| Item ID | Yes | The unique ID for the piece of data acted upon (when available) |
| Machine | Yes | The name of the machine used when the action took place. |
| Details | No | A short description of the action (when available). Many times, the details will be extensive, and you need to double-click on the row to open the addition details. |
Pagination
The Audit Log defaults to 20 results per page to prevent the system from slowing down due to excessive data. You can change the results per page by changing the number in the bottom right corner and pressing the Enter key.
Actions
Following are the types of actions recorded by the new Audit Log.
| Action | Description |
| Access | Any access of patient information. One user action could result in multiple Access lines. For example, when a user opens a patient, the ChartLogic Patient dashboard loads the patient’s demographics, medications, allergies, etc. Each would result in a separate line. |
| Add | A record was added. |
| Delete | A record was deleted. |
| Merge | Two records were merged. |
| A record was printed. | |
| Query | The user searched for a patient. |
| Transmit | A patient’s record was sent to another system. |
Record Details
Sometimes, a short description of the action will be displayed in the Details column. However, this is not always the case. Sometimes all the details are included in the other columns. Also, many times the details will be extensive, and you need to double-click on the row to open the addition details.
For example, we could see the details for this visit update by double clicking on it:
![]()
When the details open, we would see a screen like this:

This shows the fields that were changed in the update. Specifically:
- Finished was changed for 0 to -1. These are data values that indicate the visit was changed from unfinished (0) to finished (-1).
- The endtime was updated to the last time the encounter was saved.
- The text of the encounter reports was also changed. These changes could be extensive, so we need to click on that row to drill-down to more detailed information.
By clicking on the Report row, we can see what was changed to the text of the encounter report:

This is useful to track changes made to exam. For example, this section after the “Chief Complaint” shows what change was made:
![]()
Specifically, the text was changed from “The patient complains of being unwell.” to “The patient complains of mild yet constant pain in the abdomen.”
Searching for ItemID’s in the Audit Log – Added in 9.1.4
A new addition to the Audit Log is the ability to search for the item ID.
To search by Item ID, find the ID by doing your normal search, and then get the item ID (Highlighted)
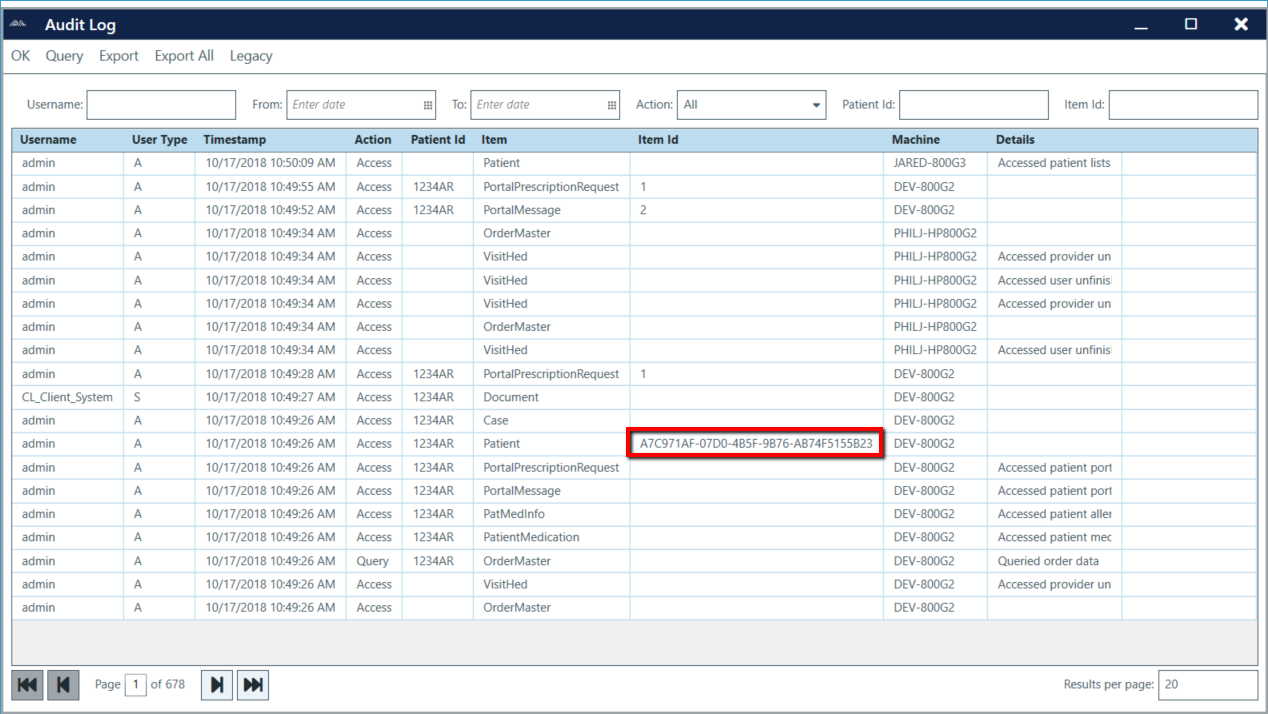
You can either copy/paste the line to the Item ID box, then delete the extra, or type the ID in the search box.
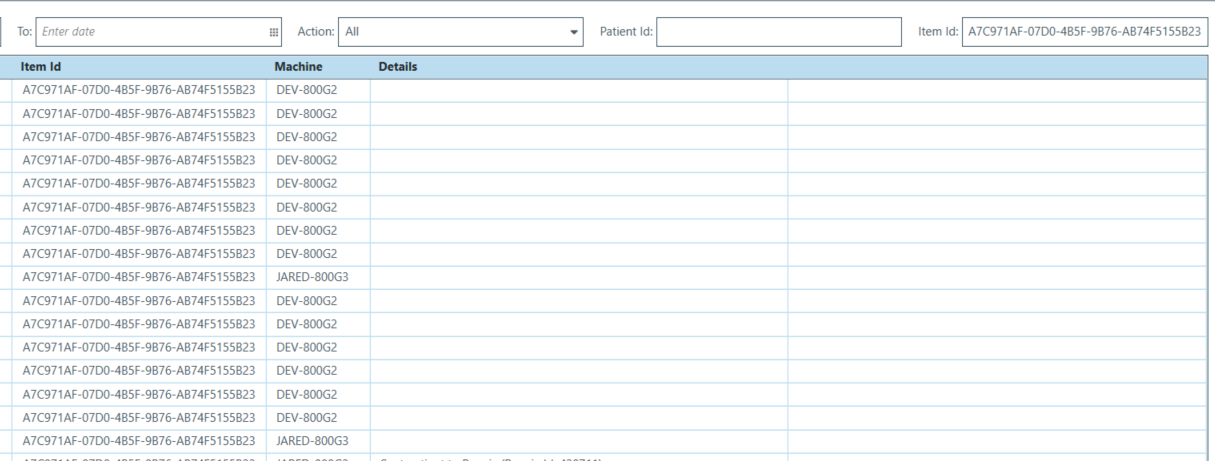
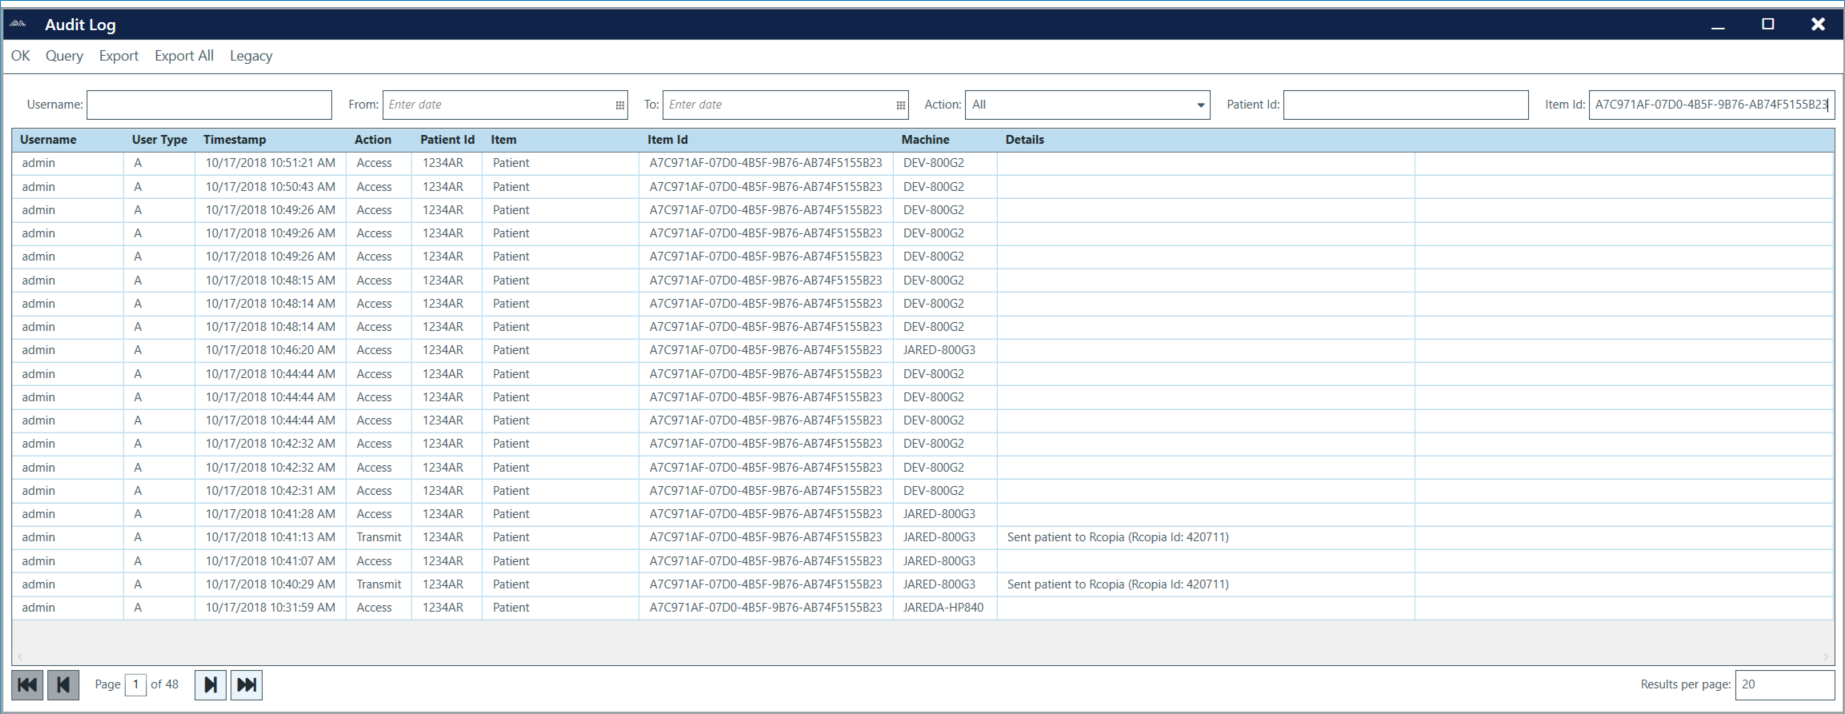
Once you do that, hit query and only the items belonging to that Item ID will display.
Connect
1220 E 7800 S, Floor 3
Sandy, UT 84094
Toll-Free (888) 337-4441