Service Reimbursement Report
- Referral Report
- Patient Appointment Report
- Claim Adjustment Report (CAR codes)
- General Navigation
- Aging Report
- Apply Credits
- Closing Run Summary
- Collection Payment Summary
- Facility Report
- Insurance Aging Report
- Patient Roster Report
- Primary Insurance Reimbursement Report
- Recall Report
- Service Reimbursement Report
- Service Status Report
- Tickle Note Report
- Transaction Detail Report
- Update Billing Account Types
- Month End
The Service Reimbursement Report is a robust tool for examining service fees within a specific timeframe, relative to allowable amounts, insurance and patient payments, and adjustments for those services.
Filter Selection
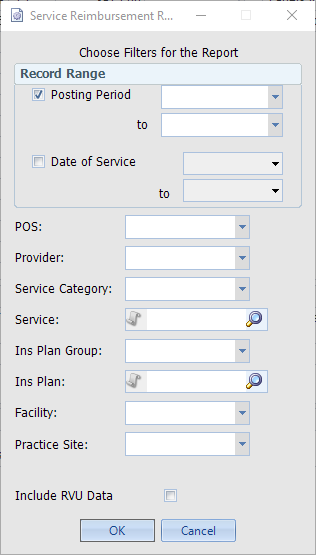
When determining the Record Range, note that the totals for what may seem like the same range (i.e. Posting Period 201307 vs DOS 07/01/2013-07/31/2013) will likely not produce the same totals. This is because of how the two types of Range work:
- Posting Period: The resulting amounts shown in the report reflect what was posted during the selected Posting Period range, regardless of the Date of Service.
- Date of Service: The resulting amounts shown reflect the all of the activity for the Date of Service, no matter which Posting Period it was posted in.
The rest of the filtering criteria can be used to make the scope of the report as broad or narrow as necessary, based on the type of analysis being performed.
The Report
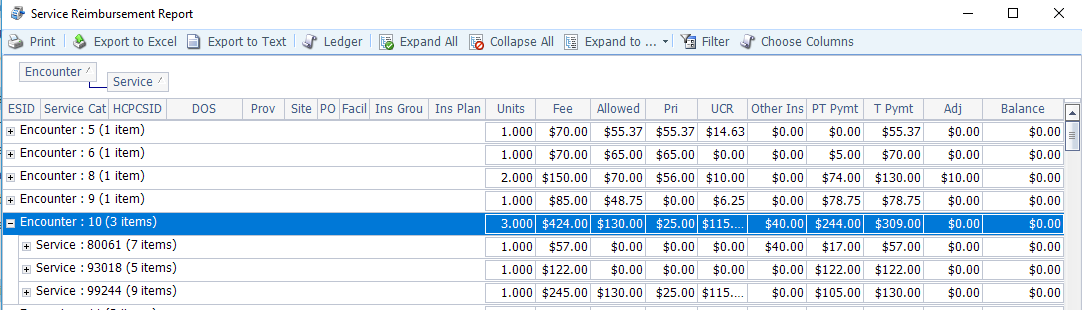

The default grouping for this report is by Encounter, then by Service, as shown above. Payment amounts are categorized by Primary (Pri), Secondary/Tertiary (Other Ins), and Patient Payment (PT Pymt). Adjustments are categorized by Contractual Adjustments (UCR) and all other Adjustments (Adj). Click the Choose Columns button to show/hide columns as needed. Columns can be re-grouped and sorted as needed.
The report can be exported to Excel for further data manipulation and calculation.
Filter/Grouping Suggestions
- Outstanding Balances: Filter by a month’s date range 3-4 months prior to the current date to review balances still outstanding for services rendered during that month. Alternately group by HCPCSID, Prov, or Ins Plan to view the totals for each.
- Service Volume: Select a Date of Service range of the previous month to see the volume of each Service provided. Alternately group by Site and Provider to review their statistics. Group by Ins Plan to arrange the Services by Insurance Plan.
- Collection Ratio: Select a Date of Service range approximately three months previous to review the amounts that have been collected towards services performed during that period. Divide the Total Payment by the Fee column to determine the percentage paid by insurance and patients.
Connect
1220 E 7800 S, Floor 3
Sandy, UT 84094
Toll-Free (888) 337-4441