Patient Roster Report
- Referral Report
- Patient Appointment Report
- Claim Adjustment Report (CAR codes)
- General Navigation
- Aging Report
- Apply Credits
- Closing Run Summary
- Collection Payment Summary
- Facility Report
- Insurance Aging Report
- Patient Roster Report
- Primary Insurance Reimbursement Report
- Recall Report
- Service Reimbursement Report
- Service Status Report
- Tickle Note Report
- Transaction Detail Report
- Update Billing Account Types
- Month End
The Patient Roster Report is a highly customizable report that produces a list of Patients who match a specific set of selected criteria. Once generated, mailing labels may be printed for all Patients on the list.
Filter Selection
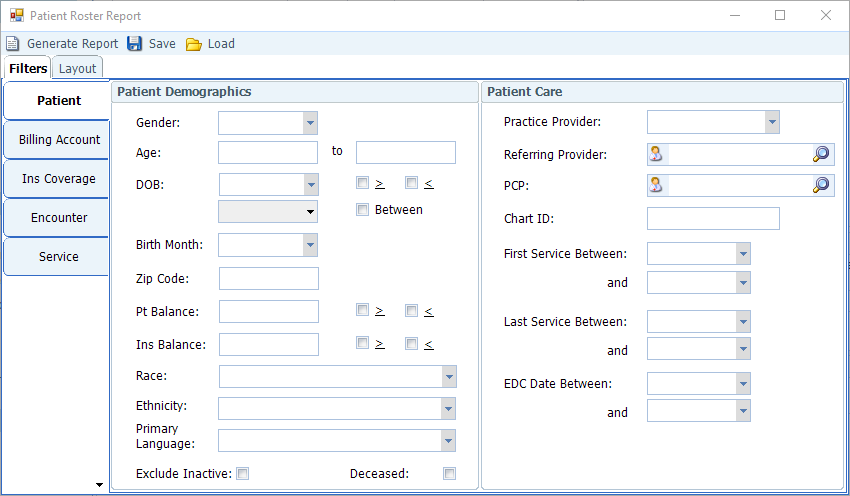
This report allows for filtering on a wide variety of Patient data fields in multiple categories, including Patient, Billing Account, Insurance Coverage, Encounter, and Service. Clicking on a filter category from the menu on the left side of the screen brings up an individual filter selection screen for that category.
Layout Selection
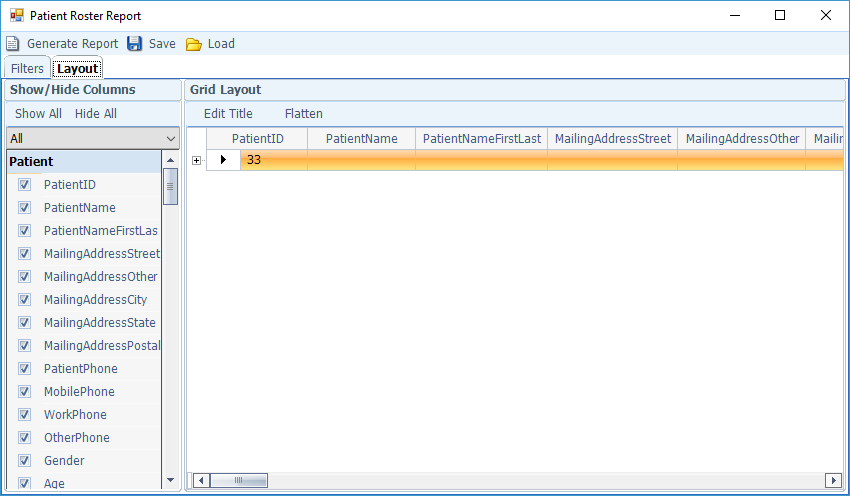
Click the Layout tab to select which columns to show on the report. On the left side of the screen, place check marks next to the columns to appear on the report. In the Grid Layout section on the right of the screen, click column headings and drag them to rearrange the order in which they appear. If a layout is intended for future use, click Save on the toolbar.
Generate Report
Once the filter and layout parameters have been set, click Generate Report on the toolbar to pull up the actual report. Once generated, further grouping, filtering, and sorting can be done directly to the report. Mailing labels can be printed by clicking Print Mailing Labels on the toolbar.
Save Filter/Layout Selections
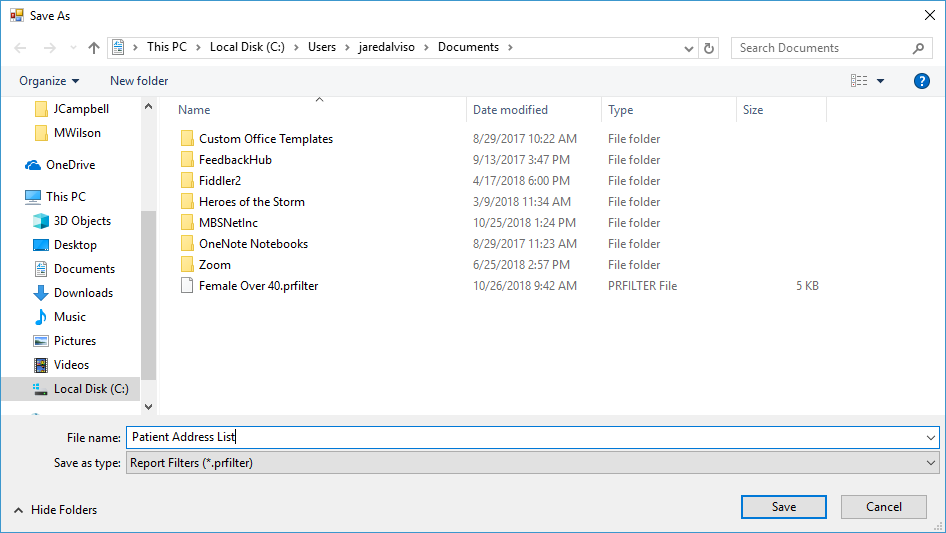
If a certain set of filter and layout parameters is meant for repeated use, it can be saved to make running the report more expedient. Once the parameters are set, click Save on the toolbar.
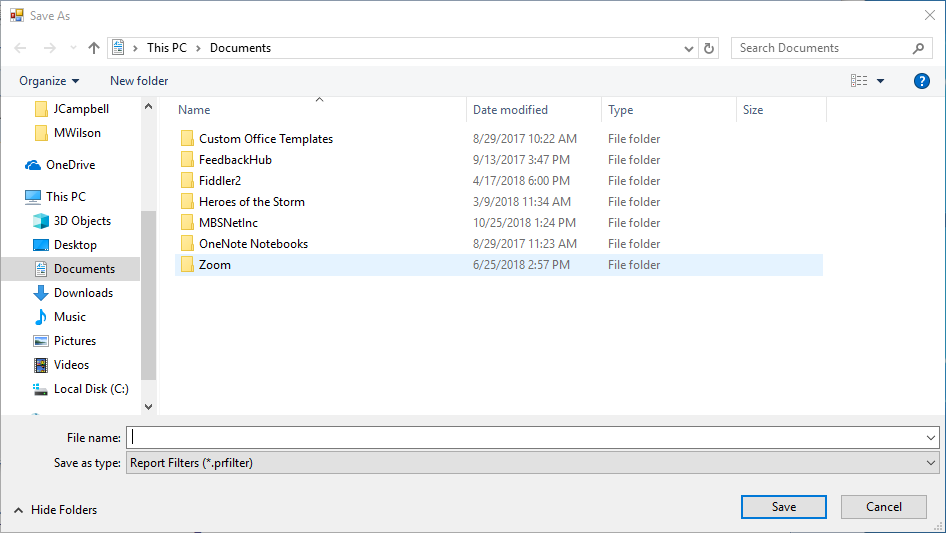
The Save As dialog box will appear. Enter a name for the file, choose the folder in which to save it, and click Save.
Generating Report from Saved Format
From the toolbar on the Filter Selection screen, click Load.
The Open dialog box will appear. Double-click to select the saved format to be used. This will return you to the Filter Selection screen from which the report can then be generated.
Connect
1220 E 7800 S, Floor 3
Sandy, UT 84094
Toll-Free (888) 337-4441